Would you like to know how to use the Numpy linspace function in your Python programs? We will go through that together.
Many technical fields such as engineering, finance, and mathematics frequently deal with evenly-spaced numbers. NumPy Linspace allows the generation of evenly-spaced numbers using Python. You can also use linspace together with Matplotlib to plot complex mathematical functions.
In this tutorial, you will understand the NumPy Linspace function!
How Does Linspace Work in NumPy?
A sequence of numbers where the difference between each consecutive element is equal is called an evenly-spaced sequence of numbers.
NumPy Linspace allows you to create evenly-spaced numbers very easily and lets you customize parameters such as the endpoint of the range, the dtype of the resulting array, and the axis if you want to work with array-like objects.
First, let’s create evenly-spaced numbers with Numpy Linspace. Numpy Linspace requires the start and the stop points of the sequence you want to create.
import numpy as np

simple_space = np.linspace(start=2, stop=10)
print(simple_space)
The output is:
[ 2.          2.16326531  2.32653061  2.48979592  2.65306122  2.81632653
  2.97959184  3.14285714  3.30612245  3.46938776  3.63265306  3.79591837
  3.95918367  4.12244898  4.28571429  4.44897959  4.6122449   4.7755102
  4.93877551  5.10204082  5.26530612  5.42857143  5.59183673  5.75510204
  5.91836735  6.08163265  6.24489796  6.40816327  6.57142857  6.73469388
  6.89795918  7.06122449  7.2244898   7.3877551   7.55102041  7.71428571
  7.87755102  8.04081633  8.20408163  8.36734694  8.53061224  8.69387755
  8.85714286  9.02040816  9.18367347  9.34693878  9.51020408  9.67346939
  9.83673469 10.        ]
The following print statement shows that the simple_space object we have created has 50 elements:
print(simple_space.shape)

[output]
(50,)
The notation (50,) represents a Python tuple.
But, what if we want to know what is the datatype of the object returned by numpy.linspace()?
To do that we can use the Python type built-in function:
print(type(simple_space))

[output]
class 'numpy.ndarray'>
The object is of type ndarray which stands for n-dimensional array.
In the example you have just seen, Numpy Linspace generates an evenly-spaced sequence with 50 elements by default.
In the next section, you will learn how you can customize the NumPy Linspace parameters.
How to Use NumPy Linspace Parameters
Besides the required parameters start and stop, Numpy Linspace has the following parameters that enable you to create customized sequences:
num: you have seen in the previous section that Numpy Linspace defaults to a sequence length of 50. You can generate an evenly-spaced sequence of numbers with a different number of elements by using the num parameter.
Let’s create an evenly-spaced sequence of numbers between 2 and 10 with 10 elements this time:
simple_space_10 = np.linspace(start=2, stop=10, num=10)
print(simple_space_10)

[output]
[ 2.          2.88888889  3.77777778  4.66666667  5.55555556  6.44444444
7.33333333 8.22222222 9.11111111 10. ]endpoint: By default, np.linspace() stops the sequence at the stop parameter. You can exclude the stop (end value of the sequence) by setting the endpoint parameter to False.
space_10_no_end = np.linspace(start=2, stop=10, num=10, endpoint=False)
print(space_10_no_end)

[output]
[2.  2.8 3.6 4.4 5.2 6.  6.8 7.6 8.4 9.2]
You can observe that if the endpoint parameter is set to False, the difference between each consecutive number is equal to the difference between start and stop divided by num.
In this scenario, for the space_10_no_end array, the difference between each number in the sequence is equal to (10-2)/10 = 0.8.
retstep: numpy.linspace() only returns a sequence by default. If you also want it to return the spacing between the elements, you can set retstep to True. This way, np.linspace will return both the sequence and the spacing.
space_10_no_end, retstep = np.linspace(start=2, stop=10, num=10, endpoint=False, retstep=True)
print(f'{space_10_no_end}\nThe spacing between the samples is: {retstep}')

[output]
[2.  2.8 3.6 4.4 5.2 6.  6.8 7.6 8.4 9.2]
The spacing between the samples is: 0.8
Here to print the output we are using a Python f-string.
dtype: numpy.linspace returns a sequence where each element is a float even if the created sequence contains integers. You can change this behavior by passing dtype to numpy.linspace.
Let’s now create the previous simple_space_10 sequence this time only with the integer part of the samples:
simple_space_10_int = np.linspace(start=2, stop=10, num=10, dtype=int)
print(simple_space_10_int)

[output]
[ 2  2  3  4  5  6  7  8  9 10]
Go back to the example in which we haven’t passed dtype to notice the difference in the output.
In the next section, you will learn about the axis parameter and how you can work with array-like objects using numpy.linspace().
How to Create Multidimensional Arrays with NumPy Linspace
Until this point, you have only worked with numeric start and stop values.
Now, let’s consider the two lists [2, 10, 5], and [10, 20, 6] as start and stop values, respectively.
The way the resulting object looks depends on the axis parameter that is set to 0 by default.
simple_array_space = np.linspace(start=[2, 10, 5], stop=[10,  20, 6], num=10)
print(simple_array_space)

[output]
[[ 2.         10.          5.        ]
 [ 2.88888889 11.11111111  5.11111111]
 [ 3.77777778 12.22222222  5.22222222]
 [ 4.66666667 13.33333333  5.33333333]
 [ 5.55555556 14.44444444  5.44444444]
 [ 6.44444444 15.55555556  5.55555556]
 [ 7.33333333 16.66666667  5.66666667]
 [ 8.22222222 17.77777778  5.77777778]
 [ 9.11111111 18.88888889  5.88888889]
 [10.         20.          6.        ]]
In this scenario numpy.linspace inserts new samples along the row axis. The starting array is [2, 10, 5] which has the shape of (3,).
If you create an evenly-spaced array with num=10, then the resulting array will have the shape (10,3).
print(simple_array_space.shape)

[output]
(10, 3)
Let’s see how the output changes if you set the value of the axis parameter to -1:
simple_array_new_axis = np.linspace(start=[2, 10, 5], stop=[10,  20, 6], num=10, axis=-1)
print(simple_array_new_axis)

[output]
[[ 2.          2.88888889  3.77777778  4.66666667  5.55555556  6.44444444
   7.33333333  8.22222222  9.11111111 10.        ]
 [10.         11.11111111 12.22222222 13.33333333 14.44444444 15.55555556
  16.66666667 17.77777778 18.88888889 20.        ]
 [ 5.          5.11111111  5.22222222  5.33333333  5.44444444  5.55555556
   5.66666667  5.77777778  5.88888889  6.        ]]
And let’s verify the shape of the array:
print(simple_array_new_axis.shape)

[output]
(3, 10)
You have learned how to pass additional parameters to the numpy.linspace function.
In the next section, you will learn how to plot fancy functions using linspace and Matplotlib.
Plotting Mathematical Functions with NumPy Linspace
NumPy linspace() can be very handy if you want to plot mathematical functions since you would want the range of a function to be evenly spaced in most cases.
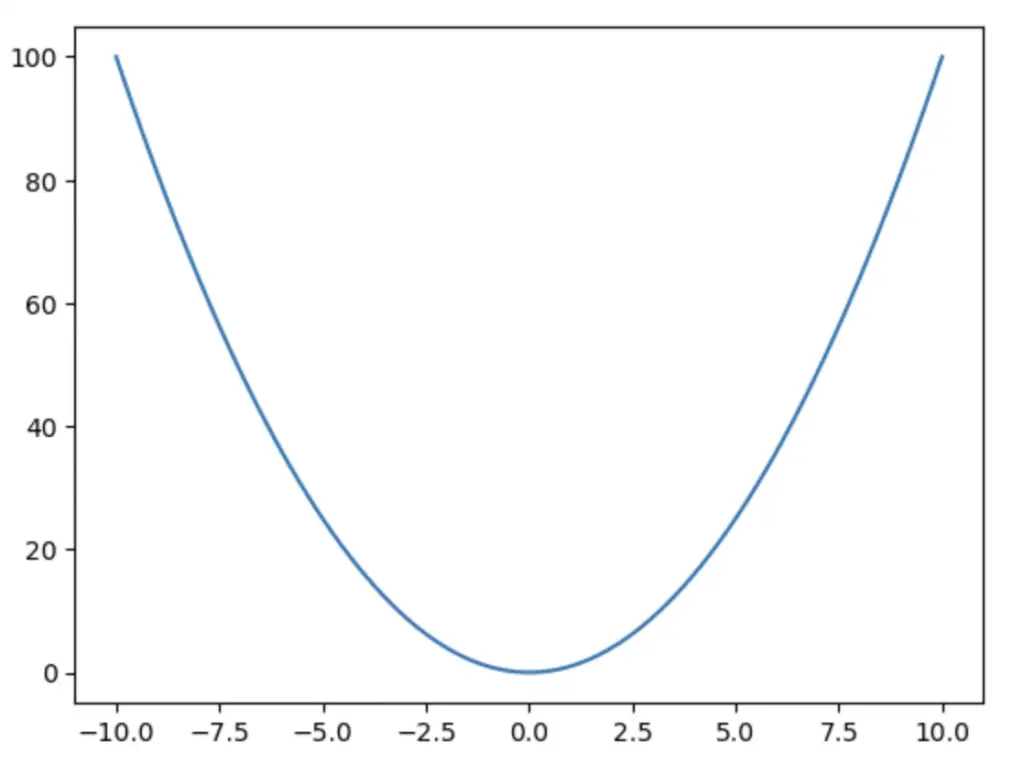
Let’s start by plotting a simple quadratic function f(x) = x^2 with linspace and Matplotlib:
import matplotlib.pyplot as plt
import numpy as np

x_range = np.linspace(-10, 10, 100)
y = x_range**2

plt.plot(x_range, y)
plt.show()
Here is the graph produced by this code:
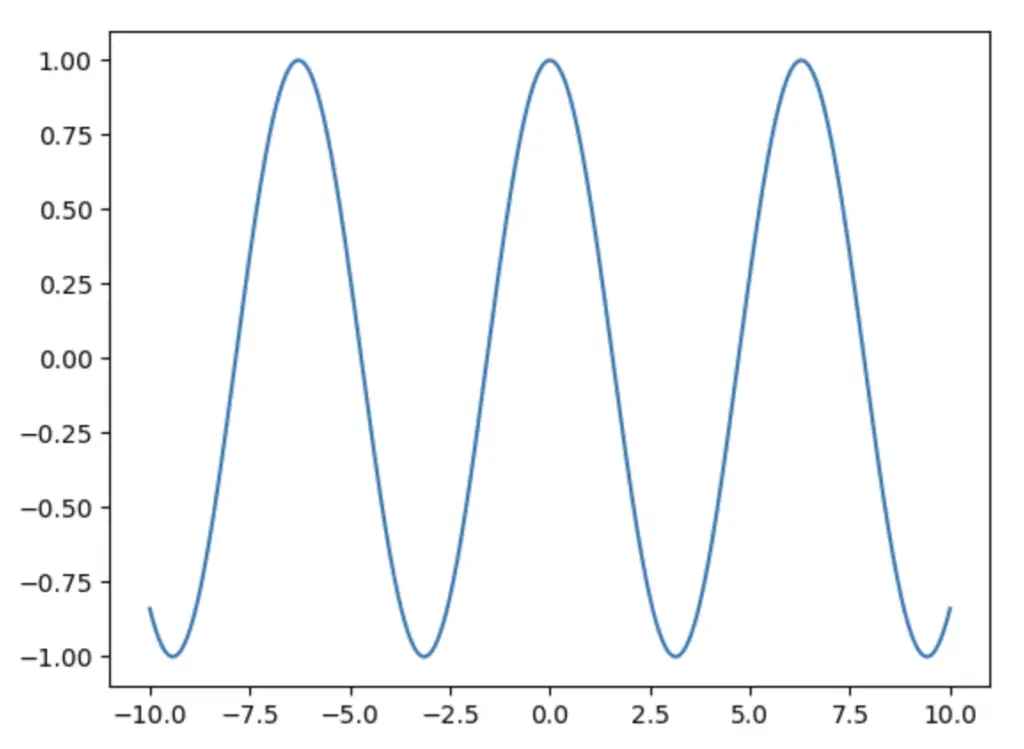
You can also use other advanced functions built inside NumPy, such as numpy.cos(), to create more advanced mathematical plotting:
import matplotlib.pyplot as plt
import numpy as np

x_range = np.linspace(-10, 10, 10**6)
y = np.cos(x_range)

plt.plot(x_range, y)
plt.show()
Let’s see the cosine function plotted by this code:
Conclusion
In this tutorial, you have learned how to create evenly spaced numbers with numpy.linspace and customize linspace parameters based on your needs.
The NumPy linspace function has a wide range of applications and you are now ready to take advantage of it in your Python programs.
Bonus read: in the last part of this article you have learned how to plot mathematical functions. When producing graphs and reports it can also be very useful to know how to plot histograms using Python!

Claudio Sabato is an IT expert with over 15 years of professional experience in Python programming, Linux Systems Administration, Bash programming, and IT Systems Design. He is a professional certified by the Linux Professional Institute.
With a Master’s degree in Computer Science, he has a strong foundation in Software Engineering and a passion for helping others become Software Engineers.