The Python Pandas library provides a function to calculate the standard deviation of a data set. Let’s find out how.
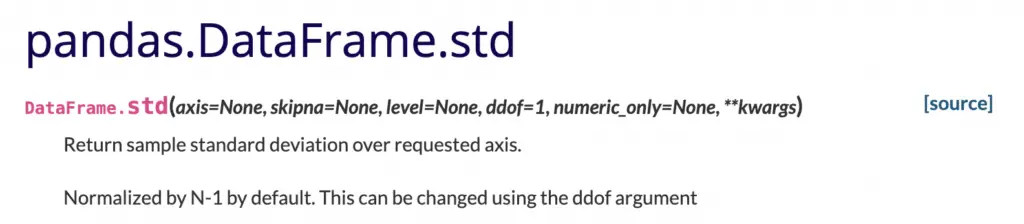
The Pandas DataFrame std() function allows to calculate the standard deviation of a data set. The standard deviation is usually calculated for a given column and it’s normalised by N-1 by default. The degrees of freedom of the standard deviation can be changed using the ddof parameter.
In this article, I will make sure the reason we use the standard deviation is clear and then we will look at how to use Pandas to calculate the standard deviation for your data.
Let’s get started!
Standard Deviation and Mean Relationship
I have read many articles that explain the standard deviation with Pandas simply by showing how to calculate it and which parameters to pass.
But, the most important thing was missing…
An actual explanation of what calculating the standard deviation of a set of data means (e.g. for a column in a dataframe).
The standard deviation tells how much a set of data deviates from its mean. It is a measure of how spread out a given set of data is. The more spread out the higher the standard deviation.
With a low standard deviation most data is distributed around the mean. On the other side a high standard deviation tells that data is distributed over a wider range of values.
Why do we use standard deviation?
To understand if a specific data point is in line with the rest of the data points (it’s expected) or if it’s unexpected compared to the rest of the data points.
Pandas Standard Deviation of a DataFrame
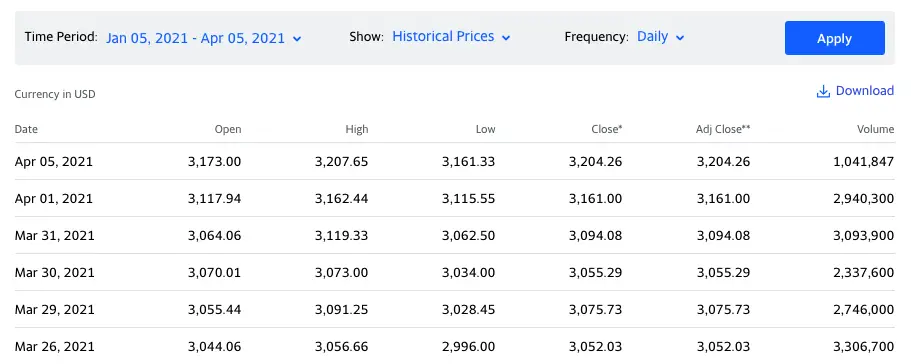
Let’s create a Pandas Dataframe that contains historical data for Amazon stocks in a 3 month period. The data comes from Yahoo Finance and is in CSV format.
Here you can see the same data inside the CSV file. In our analysis we will just look at the Close price.
And this is how we can create the dataframe from the data. The file AMZN.csv is in the same directory of our Python program.
import pandas as pd

df = pd.read_csv('AMZN.csv')
print(df)
This is the Pandas dataframe we have created from the CSV file:
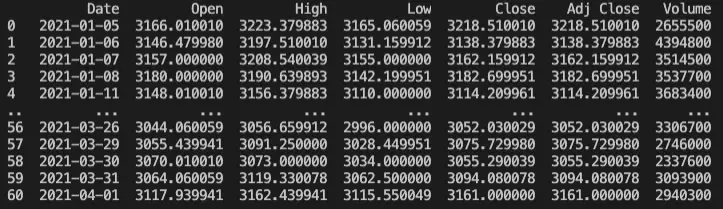
If you want to see the full data in the dataframe you can use the to_string() function:
print(df.to_string())And now let’s calculate the standard deviation of the dataframe using the std() function:
>>> print(df.std())
Open         1.077549e+02
High         1.075887e+02
Low          1.097788e+02
Close        1.089106e+02
Adj Close    1.089106e+02
Volume       1.029446e+06
dtype: float64
You can see the standard deviation for multiple columns in the dataframe.
Calculate the Standard Deviation of a DataFrame Column
Now let’s move our focus to one of the columns in the dataframe, the ‘Close’ column.
We will see how to calculate the standard deviation of a specific column. We will then refactor our code to make it more generic.
This will help us for a deeper analysis we will perform in the next section on this one column.
To calculate the standard deviation of the ‘Close’ column you have two options (I personally prefer the first one):
>>> print(df['Close'].std())
108.91061129873428
>>> print(df.std()['Close'])
108.91061129873428
So, let’s stick to the first option. If you want to calculate the mean for the same column with Pandas you can use the mean() function:
>>> print(df['Close'].mean())
3169.820640639344
Later on we will use the mean together with the standard deviation to get another piece of data for our analysis.
Now, we will refactor our code to create a generic function that returns a dataframe from a CSV file. We will also write a generic print statement that shows mean and standard deviation values for a given stock.
import pandas as pd

def get_dataframe_from_csv(filename):
    df = pd.read_csv(filename)
    return df

stock = "AMZN"
df = get_dataframe_from_csv('{}.csv'.format(stock))
print("Stock: {} - Mean: {} - Standard deviation: {}".format(stock, df['Close'].mean(), df['Close'].std()))
Notice that:
- The stock variable is used to generate the name of the CSV file and also to print the name of the stock in the final message.
- We are using the Python string format method to print our message.
The output of our program is:
Stock: AMZN - Mean: 3169.820640639344 - Standard deviation: 108.91061129873428Standard Deviation For Multiple DataFrames
I would like to make our code work for an arbitrary number of stocks…
…to do that we have to make a few changes.
The code that prints the mean and standard deviation will become a function that we can call for each stock.
Nothing changes in the logic of the code compared to the previous section, we are just refactoring it to make it more flexible.
Let’s add the following function:
def get_stats(stock):
    df = get_dataframe_from_csv('{}.csv'.format(stock))
    return df['Close'].mean(), df['Close'].std()
What kind of Python data type do you think this function returns?
>>> stock = "AMZN"
>>> stats = get_stats(stock)
>>> print(stats)
(3169.820640639344, 108.91061129873428)
The function returns a tuple where the first element is the mean and the second element is the standard deviation.
And now that we have the data we need in this tuple we can print the same message as before:
print("Stock: {} - Mean: {} - Standard deviation: {}".format(stock, stats[0], stats[1]))Before continuing with this tutorial run it on your machine and make sure it works as expected.
Standard Deviation For Multiple DataFrames
Our code is ready to calculate the standard deviation for multiple stocks.
I want to enhance our program so it can calculate the standard deviation of the close price for three different stocks: Amazon, Google and Facebook.
You can retrieve the historical data in CSV format for Google and Facebook from Yahoo Finance in the same way we have done it in the first section for Amazon (the historical period is the same).
Now, we can simply update our code to use a for loop that goes through each one of the stocks stored in a Python list:
stocks = ["AMZN", "GOOG", "FB"]
for stock in stocks:
    stats = get_stats(stock)
    print("Stock: {} - Mean: {} - Standard deviation: {}".format(stock, stats[0], stats[1]))
That’s super simple! Nothing else changes in our code. And here is what we got:
Stock: AMZN - Mean: 3169.820640639344 - Standard deviation: 108.91061129873428
Stock: GOOG - Mean: 1990.8854079836065 - Standard deviation: 127.06676441921294
Stock: FB - Mean: 269.7439343114754 - Standard deviation: 11.722428896760924
You can now compare the three stocks using the standard deviation.
This doesn’t give us enough information to understand which one has performed the best but it’s a starting point to analyse our data.
Coefficient of Variation With Pandas
But, how can we compare the stats we have considering that the values of the mean for the three stocks are very different from each other?
An additional statistical metric that can help us compare the three stocks is the coefficient of variation.
The coefficient of variation is the ratio between the standard deviation and the mean.
Let’s add it to our code.
We could print its value as ratio between the standard deviation and the mean directly in the final print statement…
…but instead I will calculate it inside the get_stats() function. In this way I can continue expanding this function if I want to add more metrics in the future.
The function becomes:
def get_stats(stock):
    df = get_dataframe_from_csv('{}.csv'.format(stock))
    mean = df['Close'].mean()
    std = df['Close'].std()
    cov = std / mean
    return mean, std, cov
Then we can add the coefficient of variation to the print statement:
stocks = ["AMZN", "GOOG", "FB"]
for stock in stocks:
    stats = get_stats(stock)
    print("Stock: {} - Mean: {} - Standard deviation: {} - Coefficient of variation: {}".format(stock, stats[0], stats[1], stats[2]))
The final output is:
Stock: AMZN - Mean: 3169.820640639344 - Standard deviation: 108.91061129873428 - Coefficient of variation: 0.034358603733732805
Stock: GOOG - Mean: 1990.8854079836065 - Standard deviation: 127.06676441921294 - Coefficient of variation: 0.06382424820115978
Stock: FB - Mean: 269.7439343114754 - Standard deviation: 11.722428896760924 - Coefficient of variation: 0.043457618154352805
Difference Between Pandas and NumPy Standard Deviation
The NumPy module also allows to calculate the standard deviation of a data set.
Let’s calculate the standard deviation for Amazon Close prices in both ways to see if there is any difference between the two.
You would expect to see the same value considering that the standard deviation should be based on a standard formula.
We will use the following dataframe:
stock = "AMZN"
df = get_dataframe_from_csv('{}.csv'.format(stock))
Standard deviation using Pandas
>> print(df['Close'].std())
108.91061129873428
Standard deviation using NumPy
>>> import numpy as np
>>> print(np.std(df['Close']))
108.01421242306225
The two values are similar but they are not the same…
When I look at the official documentation for both std() functions I notice a difference.
The Pandas documentation says that the standard deviation is normalized by N-1 by default.
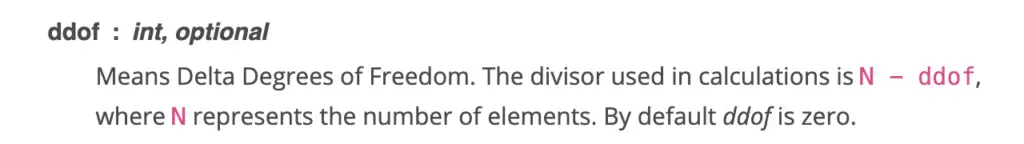
According to the NumPy documentation the standard deviation is calculated based on a divisor equal to N - ddof where the default value for ddof is zero. This means that the NumPy standard deviation is normalized by N by default.
Let’s update the NumPy expression and pass as parameter a ddof equal to 1.
>>> print(np.std(df['Close'], ddof=1))
108.91061129873428
This time the value is the same returned by Pandas.
If you are interested in understanding more about the difference between a divisor equal to N or N-1 you can have a look here.
Plot Standard Deviation With Matplotlib
An important part of data analysis is also being able to plot a given dataset.
Let’s take the dataset for the Amazon stock…
We will plot all the values using Matplotlib and we will also show how data points relate to the mean.
import pandas as pd
import matplotlib.pyplot as plt
def get_dataframe_from_csv(filename):
df = pd.read_csv(filename)
return df
stock = "AMZN"
df = get_dataframe_from_csv('{}.csv'.format(stock))
data = df['Close']
mean = df['Close'].mean()
std = df['Close'].std()
min_value = min(data)
max_value = max(data)
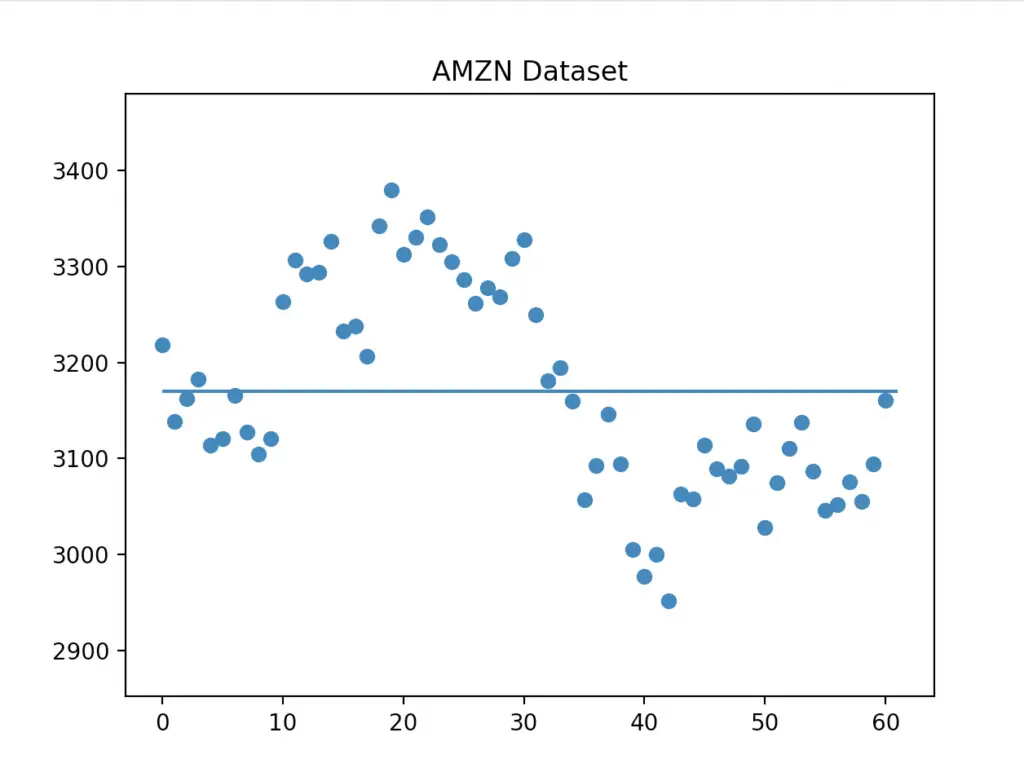
plt.title("AMZN Dataset")
plt.ylim(min_value - 100, max_value + 100)
plt.scatter(x=df.index, y=df['Close'])
plt.hlines(y=mean, xmin=0, xmax=len(data))
plt.show()We have centered the graph based on the minimum and maximum of the ‘Close’ data points (plt.ylim).
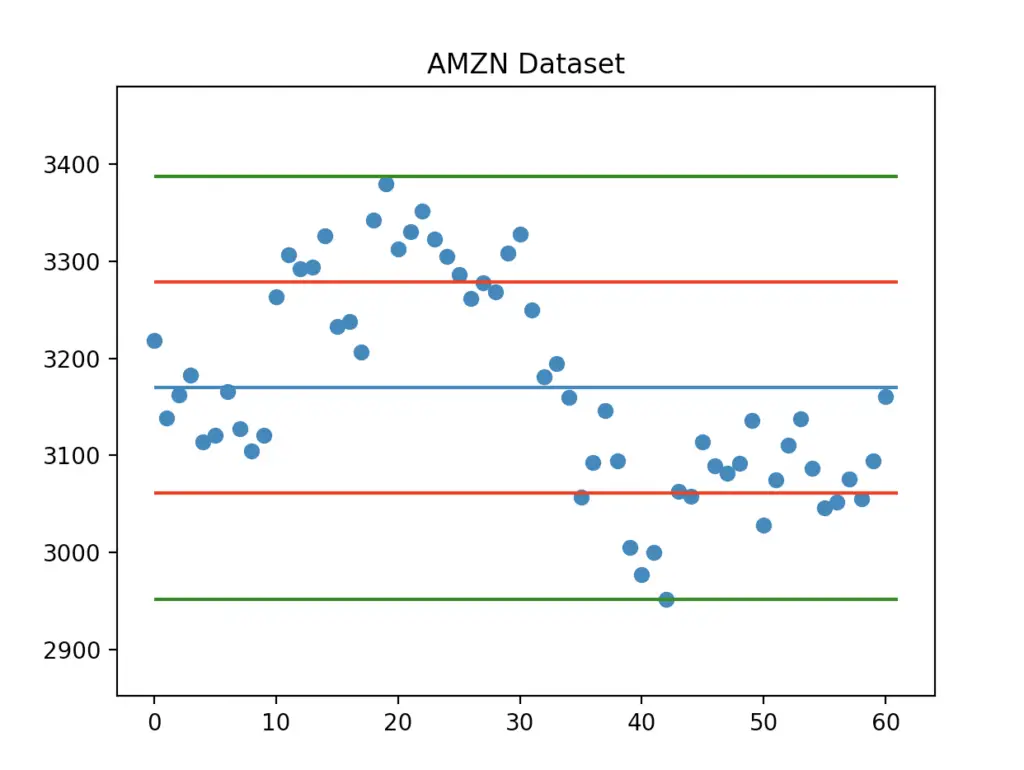
We can also show how many data points fall within one or two standard deviations from the mean. Let’s do that by adding the following lines before plt.show().
plt.hlines(y=mean - std, xmin=0, xmax=len(data), colors='r')
plt.hlines(y=mean + std, xmin=0, xmax=len(data), colors='r')
plt.hlines(y=mean - 2*std, xmin=0, xmax=len(data), colors='g')
plt.hlines(y=mean + 2*std, xmin=0, xmax=len(data), colors='g')
And here is the final graph:
Now you also know how to plot data points, mean, and standard deviation using Matplotlib.
Conclusion
In this tutorial, we have seen how mean and standard deviation relate to each other and how you can calculate the standard deviation for a set of data in Python.
Being able to plot this data with Matplotlib also helps you in the data analysis.
You can download the full source code of this tutorial and the CSV files here.

Claudio Sabato is an IT expert with over 15 years of professional experience in Python programming, Linux Systems Administration, Bash programming, and IT Systems Design. He is a professional certified by the Linux Professional Institute.
With a Master’s degree in Computer Science, he has a strong foundation in Software Engineering and a passion for helping others become Software Engineers.