Google Colab has attracted tremendous attention from developers all around the world. In this tutorial, you will learn the benefit of Colab and how to set up a Colab notebook for Python development.
Let’s write and execute Python code using Colab!
Why Use Google Colab?
A Colab notebook is an interactive environment that enables you to:
- Execute code
- Insert images
- Write Rich Text that supports HTML and LaTeX.
All this in a beginner-friendly environment.
For a lot of ambitious programmers, one great feature Colab provides is free GPU and TPU access.
GPUs (Graphics Processing Units) are frequently utilized to speed up computational algorithms. Examples of fields this applies to are building deep learning models or high-frequency trading.
TPUs (Tensor Processing Units), on the other hand, are designed by Google specifically for accelerating machine learning models.
However, those traits of GPU and TPU also make them very expensive and not easily accessible to many people.
With Colab, you have free access to GPU/TPU up to an allowed limit. This will save you a lot of time in your computations.
Another huge benefit Colab brings to the table is the fact that Colab is a cloud-based notebook. This means it executes and stores your code on remote servers rather than your computer.
In other words, you won’t have to worry about storing large notebooks and data on your computer.
Google Colab also:
- provides pre-installed libraries so that you will not even need to run the “pip install” command on Colab.
- lets you link your Google Drive account directly to your notebook. This is a remarkable change in your work style if you frequently work with data.
- it is compatible with group projects since it allows you to share your notebook in Editor mode. This means that other people who have the link to your notebook can also edit your notebook in place.
How Do You Use Google Colab For The First Time?
Before using Google Colab for Python development let’s get familiar with Colab’s UI.
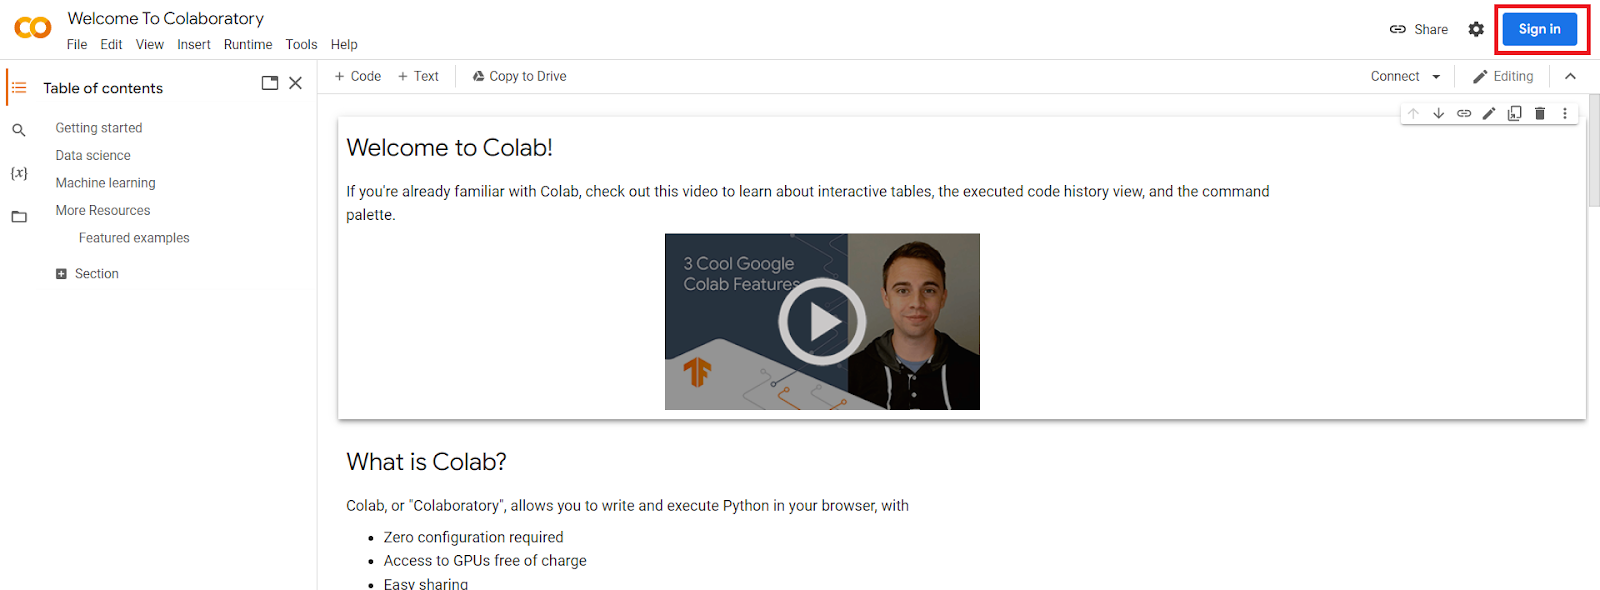
To start with Colab, go to colab.research.google.com and sign in if you haven’t already:
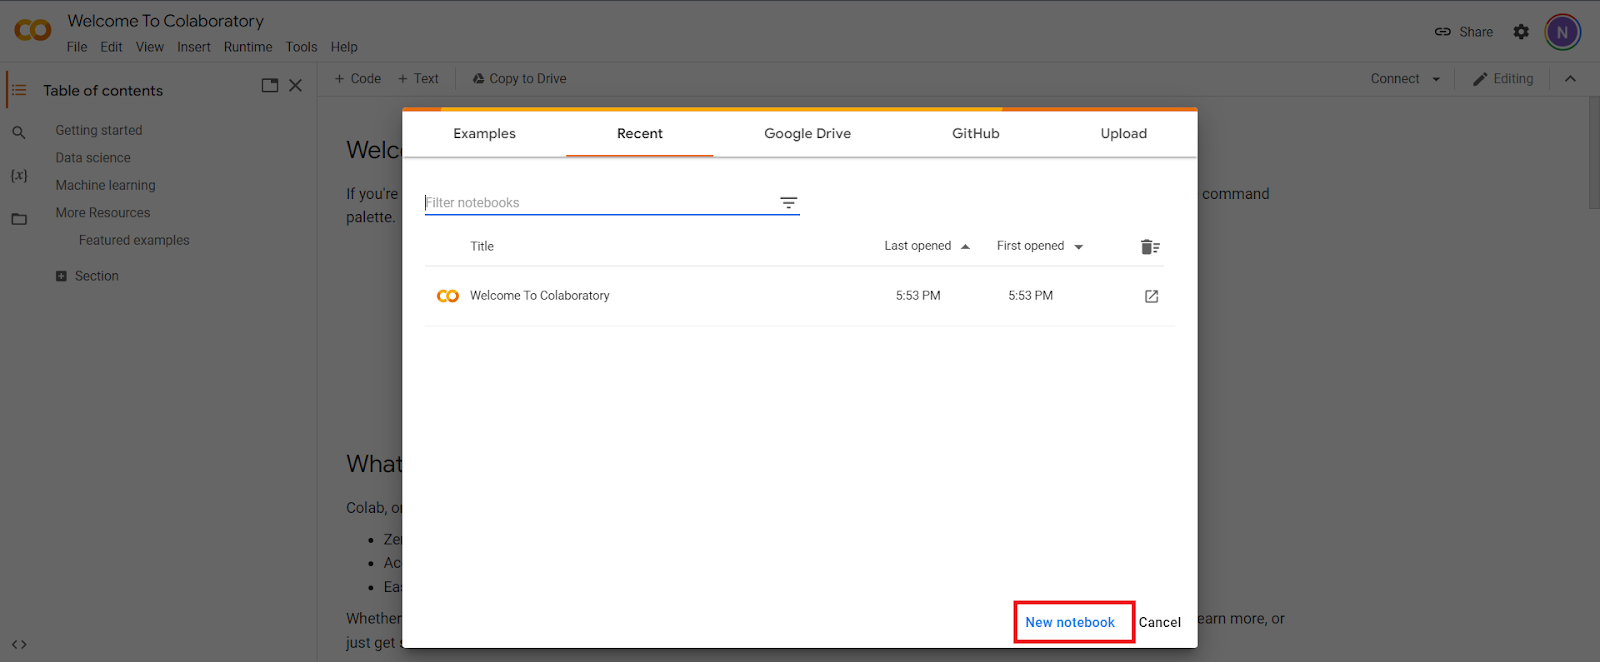
After logging in with your credentials, create a new notebook on the page that opens up by clicking on “New notebook”:
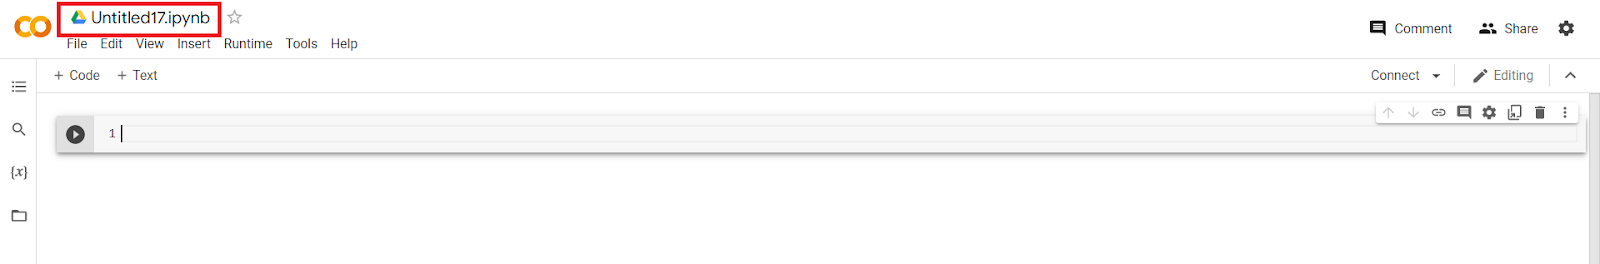
First, let’s start by renaming our notebook. You can simply click on the name, as shown below, to rename it.
Let’s call it to sample.ipynb:
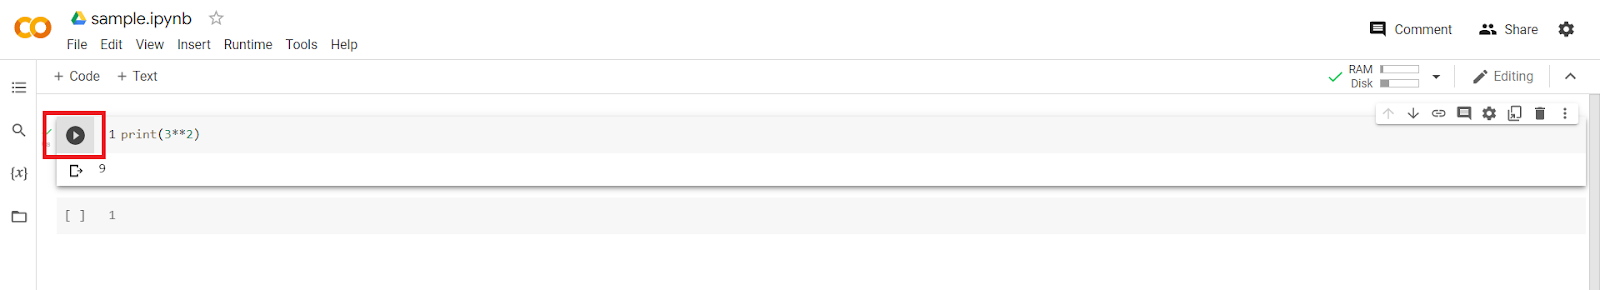
Use the print function and the exponent operator as shown below.
You can run the code in each cell by clicking the play button on the left side of the code:
You can create a markdown cell by clicking on the Text button shown under the name of the notebook. The button Text appears also if you move your mouse over the upper boundary of a cell (see image below):

You can now create a header just by adding the hashtag symbol # before any text.
Let’s create a header named Header 1, and also run some basic operations on the code cells below it.
One great property of headers on Colab is that you can hide all code cells under a header. To do that, click on the button on the left of the header.
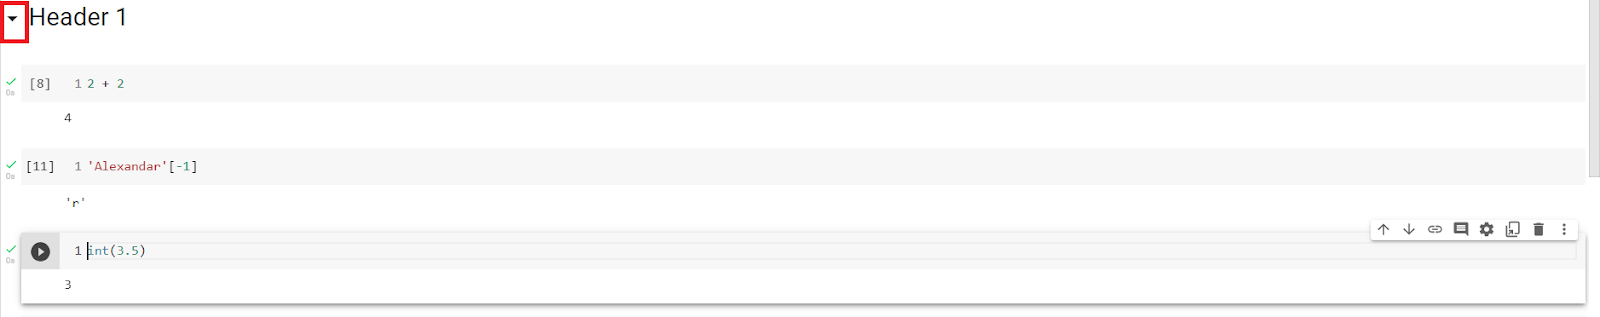
You will then see that all the cells under Header 1 become hidden.
Also, click on the three-dot symbol on the right-hand side to copy all the cells under a header.

How To Run Python Code in Colab
Add a code cell to your notebook and start writing Python code in the same way you would in your IDE.
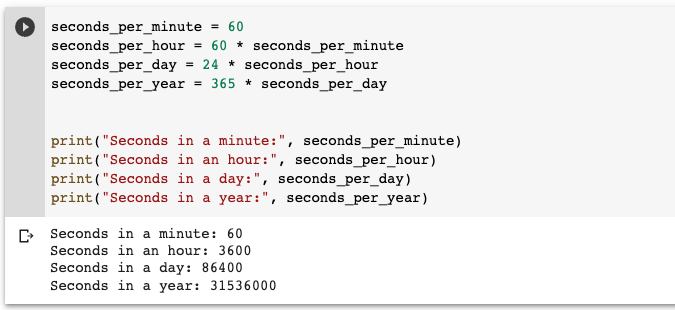
Let’s add simple Python code that prints the number of seconds in a minute, in an hour, and in a year.
seconds_per_minute = 60
seconds_per_hour = 60 * seconds_per_minute
seconds_per_day = 24 * seconds_per_hour
seconds_per_year = 365 * seconds_per_day


print("Seconds in a minute:", seconds_per_minute)
print("Seconds in an hour:", seconds_per_hour)
print("Seconds in a day:", seconds_per_day)
print("Seconds in a year:", seconds_per_year)
After specifying the code in the cell click on the “Run cell” button to execute the code.
Here is what it looks like in our notebook:
As you can see we didn’t have to install Python. But, which version of Python are we using in Colab?
Let’s find out…
To check the version of Python used in Google Colab you have to use the command “!python –version”.
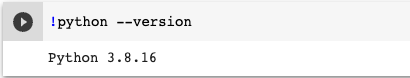
As you can see, we are using Python 3.8.16.
How Do You Import a Python Module in Google Colab?
Based on what we have seen so far, we should be able to import Python modules directly into our code cell.
Let’s test this assumption by writing a program that uses the Python random module to generate a random number.
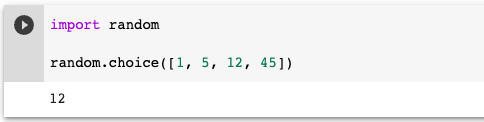
It works!
As you can see, Colab is very easy to use and it’s great that it requires no setup to do coding in Python.
Can You Use Images in Google Colab Notebooks?
Now, let’s create another header named Header 2 and insert an image below it. You can display an image inside a markdown (text) cell using the following format:
So, let’s insert the Python logo from https://www.python.org/static/img/python-logo@2x.png into the text cell.
You will then see the image uploaded to the cell.
How Do You Create a List in Colab?
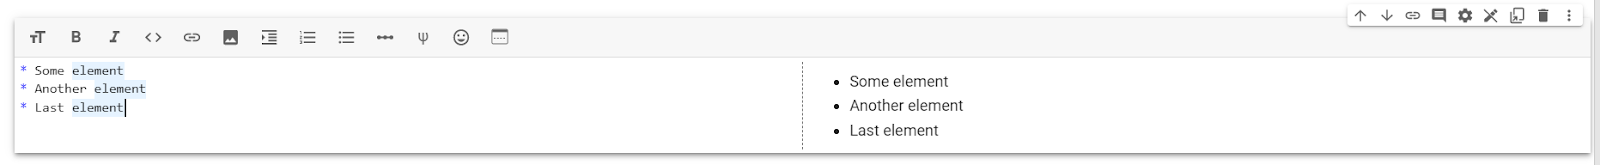
If you want to create unordered lists, you can just add * before the elements in a text cell:
* Some element
* Another element
* Last element
The output is:
Can You Use LaTeX in Google Colab?
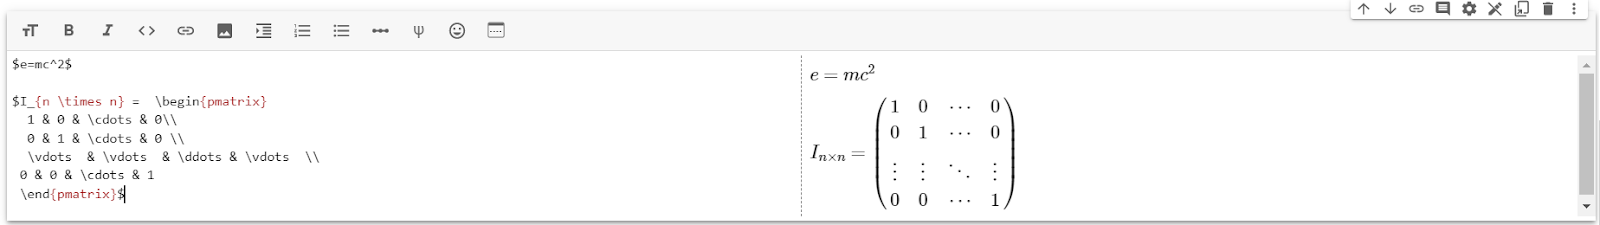
Colab markdown cells can run LaTeX syntax. You just have to enclose any valid LaTeX statement with $ signs.
For instance, let’s add these two mathematical expressions into our markdown cell:
$e=mc^2$

$I_{n \times n} =  \begin{pmatrix}
  1 & 0 & \cdots & 0\\
  0 & 1 & \cdots & 0 \\
  \vdots  & \vdots  & \ddots & \vdots  \\
 0 & 0 & \cdots & 1
 \end{pmatrix}$
That looks cool!
Imagine how many things you can do with it!
How Do I Access Google Drive Data in Google Colab?
Are you trying to upload data in Colab?
You can upload data to Colab by first clicking on the Files icon on the left bar and then clicking on the upload symbol:
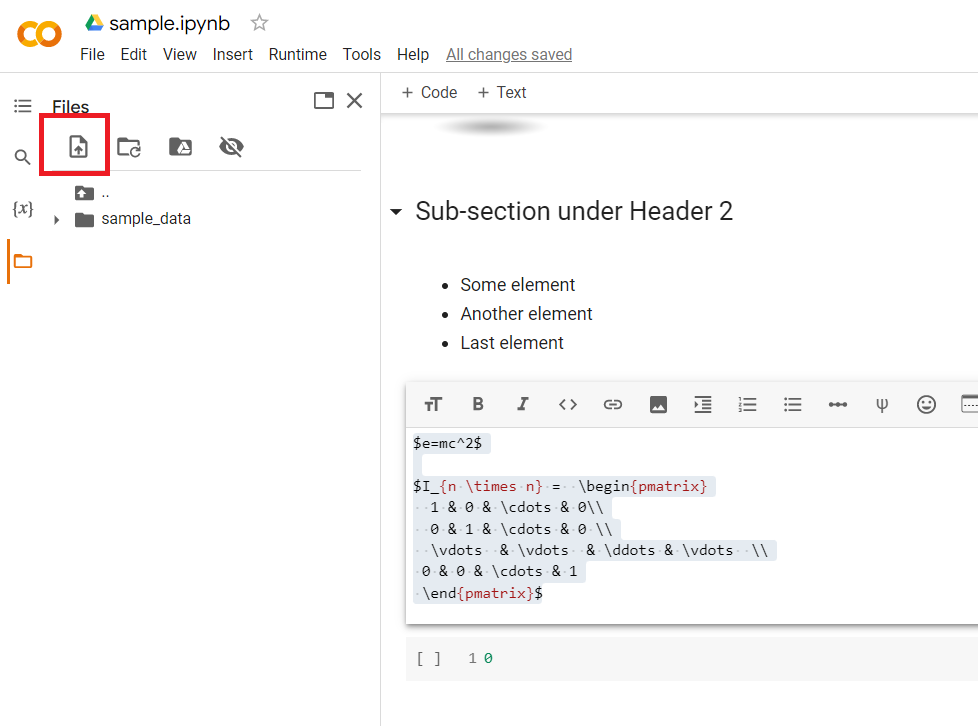
But this is not the best approach to handling external data…
There is a much easier way to upload your data to Google Colab: mounting your Google Drive account to Colab.
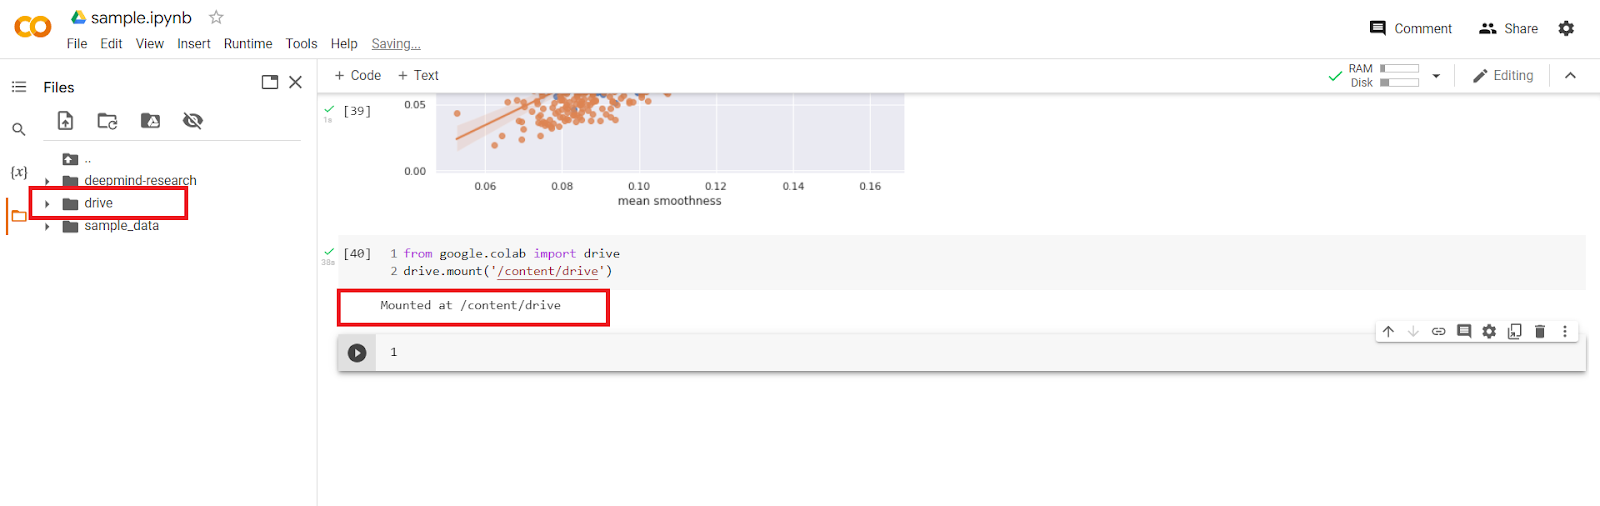
You can mount your Google Drive to your Colab notebook using the following code in a code cell:
from google.colab import drive
drive.mount('/content/drive')
You then have to provide your notebook access to your Google Drive:

After entering your credentials and waiting for a few seconds, you will see that the drive folder will be shown in the Files section on the left. Now you can access everything your Google Drive contains!
Can You Execute Linux Commands in Google Colab?
It’s also possible to invoke Linux system commands in Google Colab. You can see the shortcuts for common operations with the following command:
!ls /bin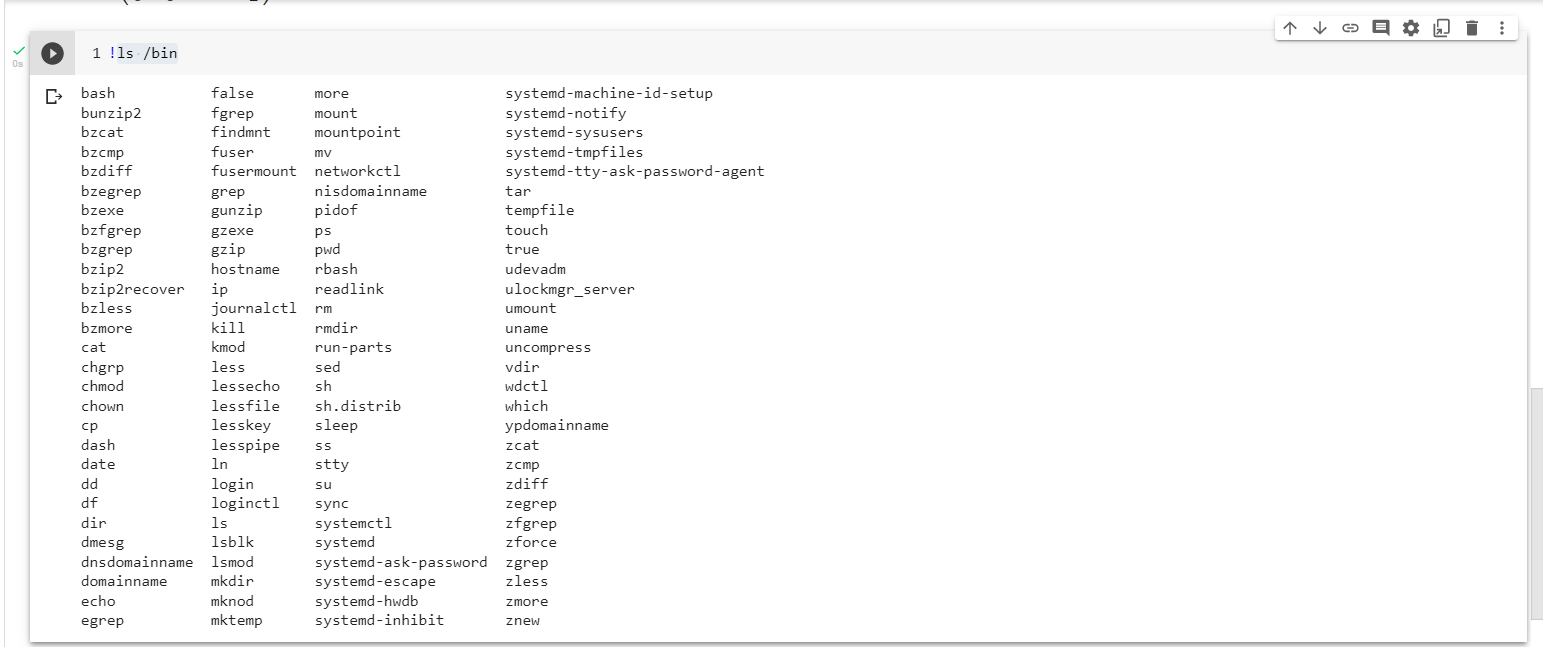
For example, print the current working directory using the following command:
!pwdCan You Clone a Git Repository in Google Colab?
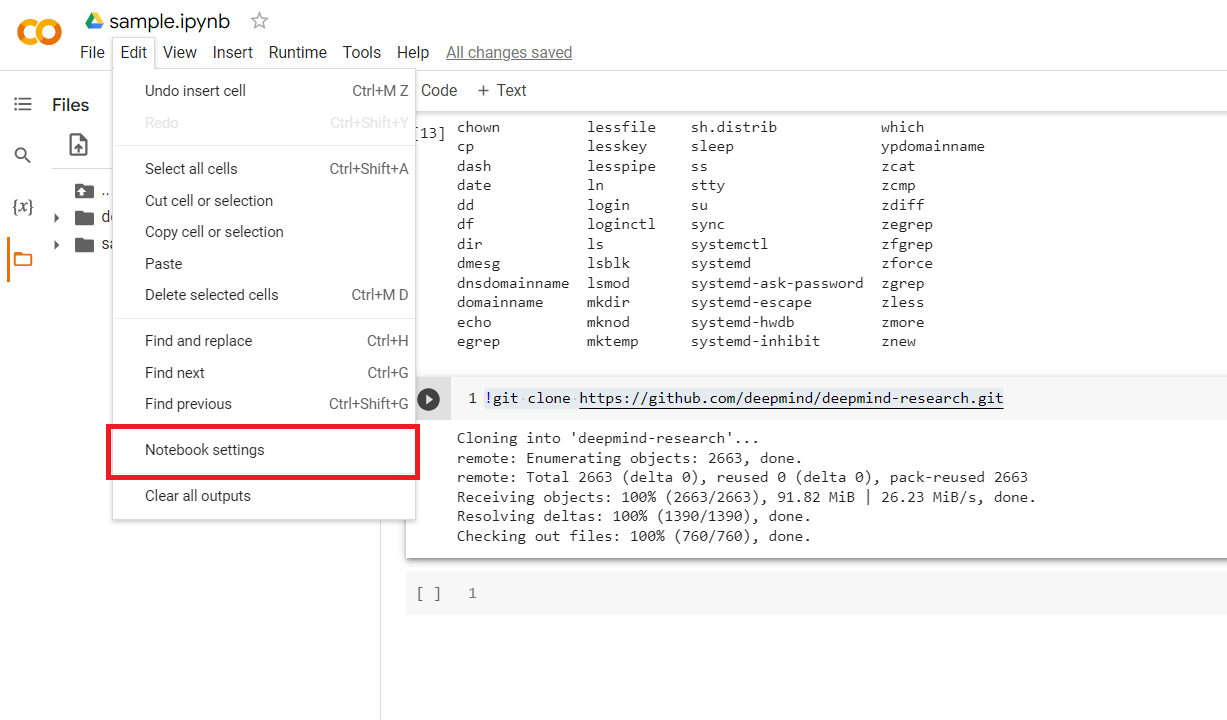
You can even clone a GitHub repository to your Colab notebook!
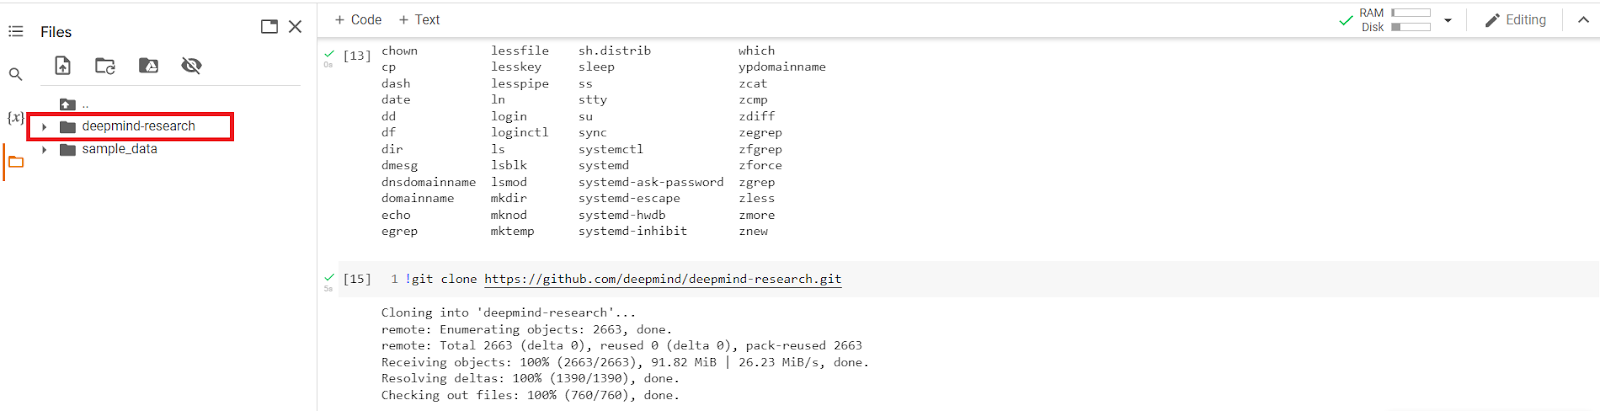
For instance, let’s clone the following DeepMind repository to our notebooks as follows:
!git clone https://github.com/deepmind/deepmind-research.gitIt may take a few seconds for the cloned repository to show up in the Files section on the left bar:
How Can You Download or Share a Google Colab Notebook?
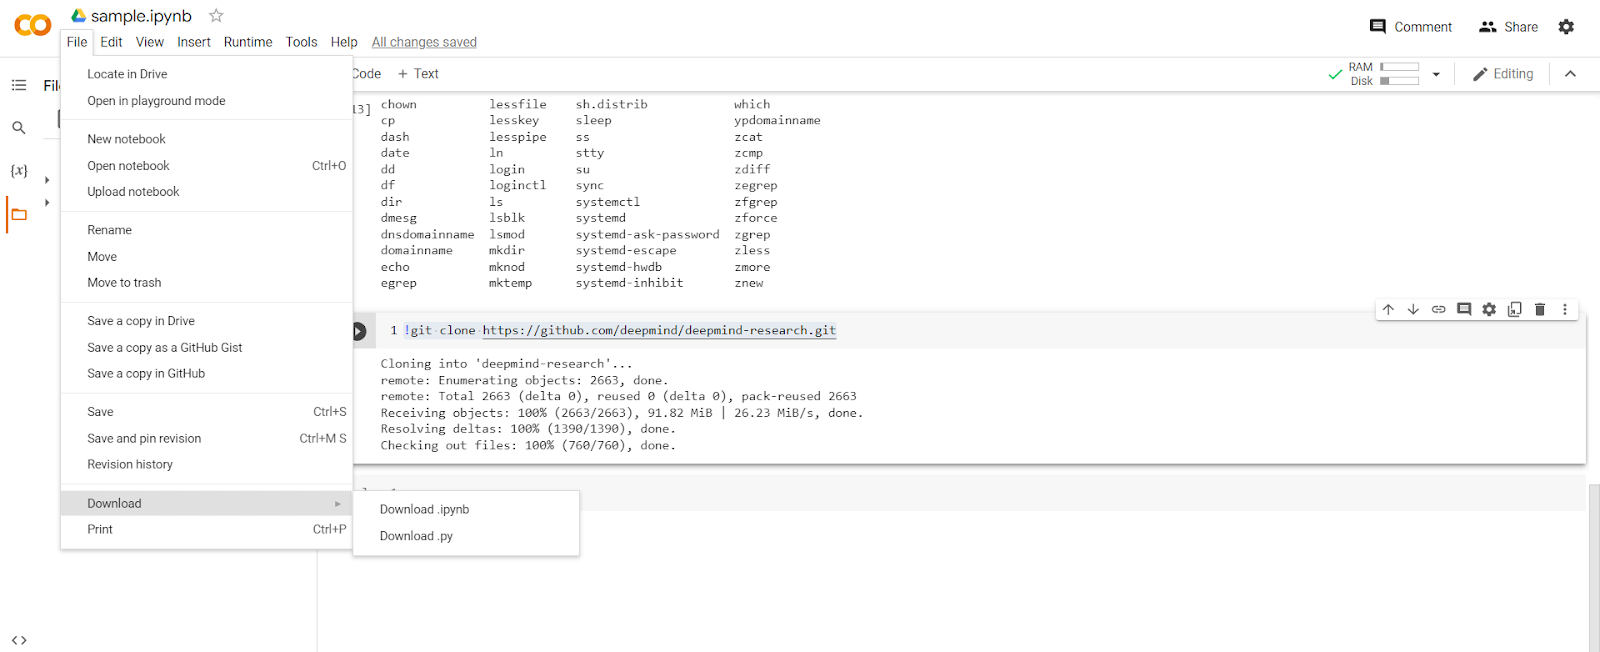
Let’s download this notebook we have created by first clicking File on the top menu and then selecting Download.
Colab allows you to download your notebooks either as a .ipynb or .py file:
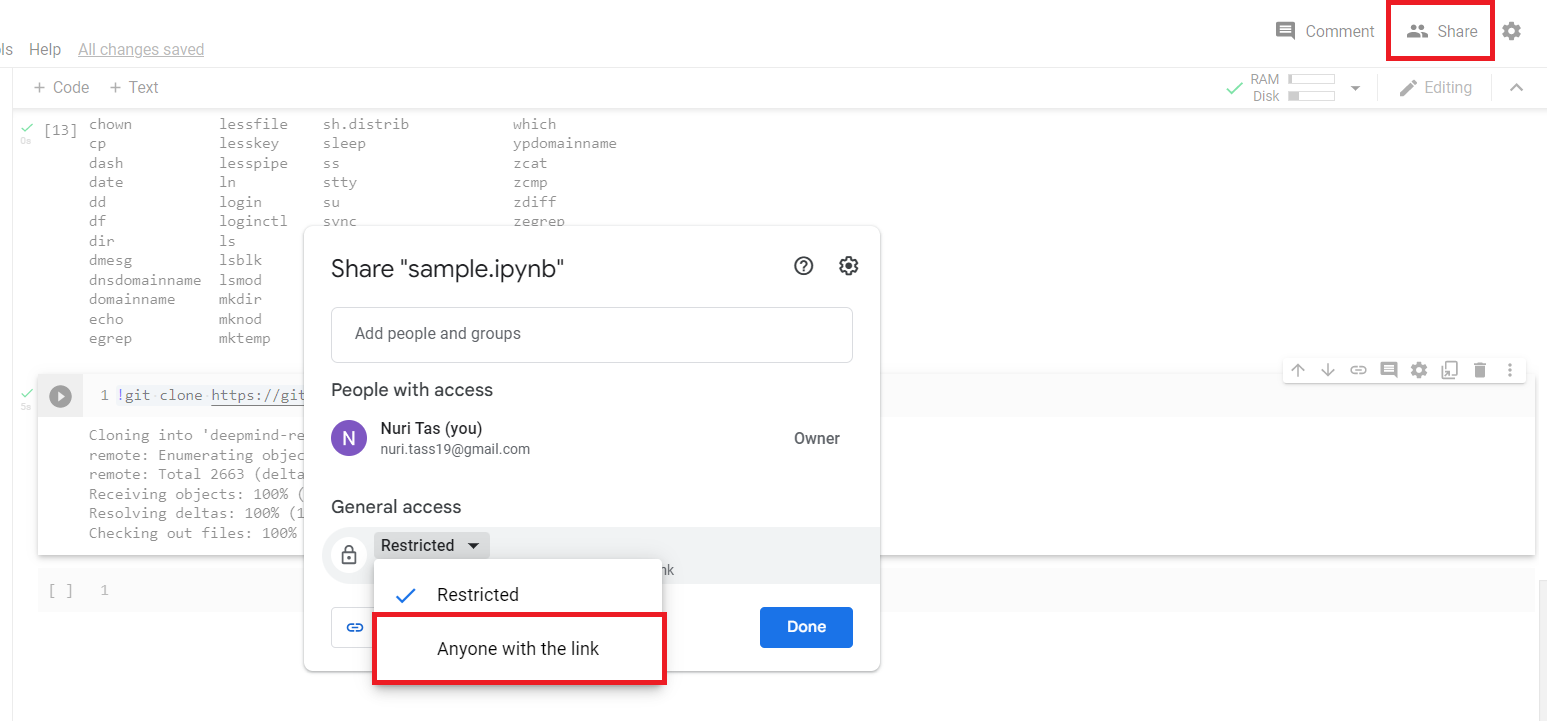
However, there is a much easier way to share your Colab notebooks: with the Share button!
By default, Google Colab shares the notebooks in restricted mode, i.e. only people whose Gmail accounts are specified in the Add people and groups field can see the notebook.
If you want to make your notebook visible to everyone with the link, you have to choose the option Anyone with the link:
You can then even choose Editor mode which allows people who have the link to execute the code and change the notebook:

Access to GPU and TPU with Colab
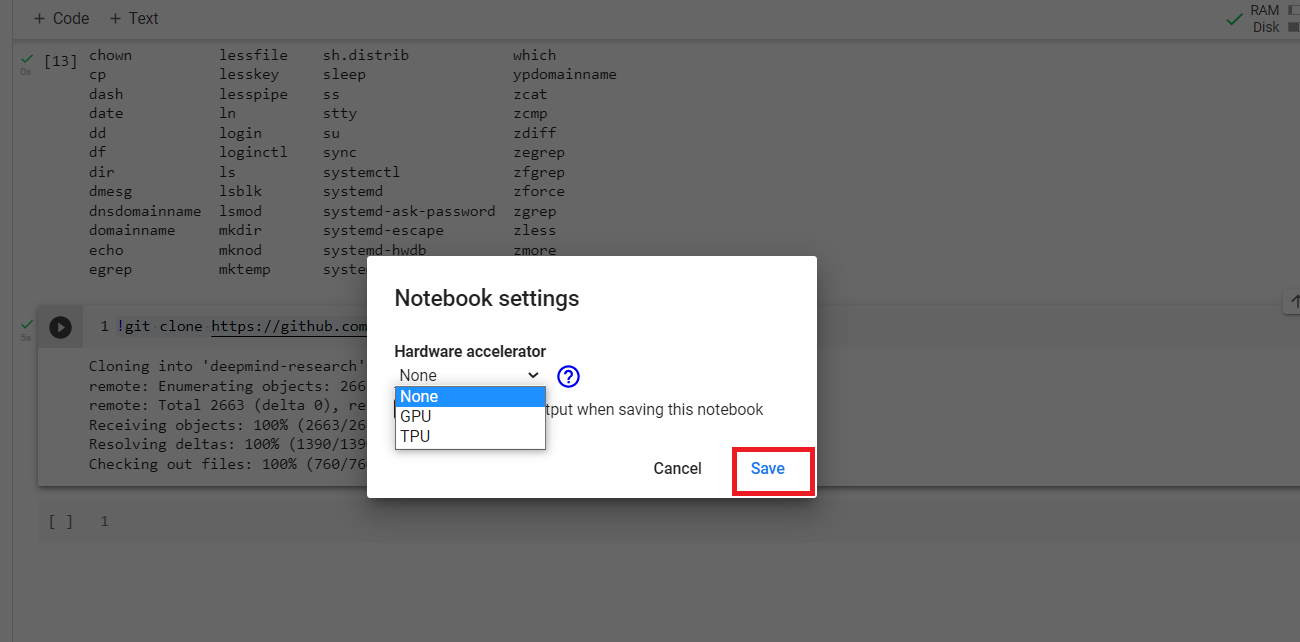
First head over to the Edit menu and then click on Notebook Settings to change the hardware accelerator:
Then choose whatever accelerator you want to activate and don’t forget to Save your selection!
Data Science with Google Colab
You can exploit the power of visualization with Google Colab using Python.
Let’s run the following Python code to import the necessary modules. You may also need the %matplotlib inline magic to display matplotlib plots.
import pandas as pd
import numpy as np
import matplotlib.pyplot as plt
import seaborn as sns

from sklearn.datasets import load_iris

%matplotlib inline
Then create a dataframe for load_iris from sklearn.datasets.
iris = load_iris()

df = pd.DataFrame(iris['data'], columns=iris['feature_names'])
df['target'] = iris['target']
df.head()
You will then see the following output in your Colab notebook:

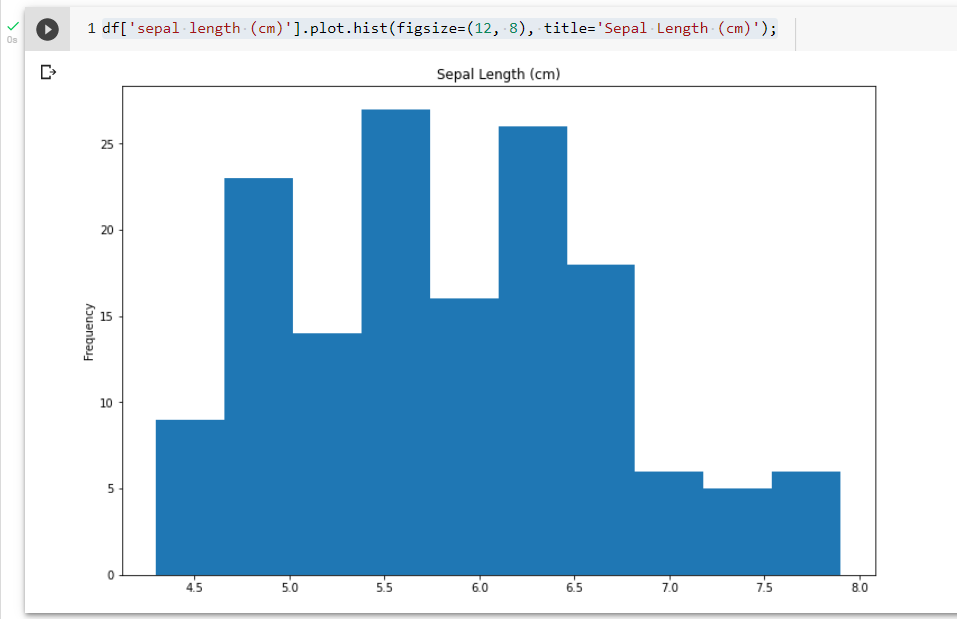
Now, create a simple histogram for the sepal length (cm) column as follows:
df['sepal length (cm)'].plot.hist(figsize=(12, 8), title='Sepal Length (cm)');The output is:
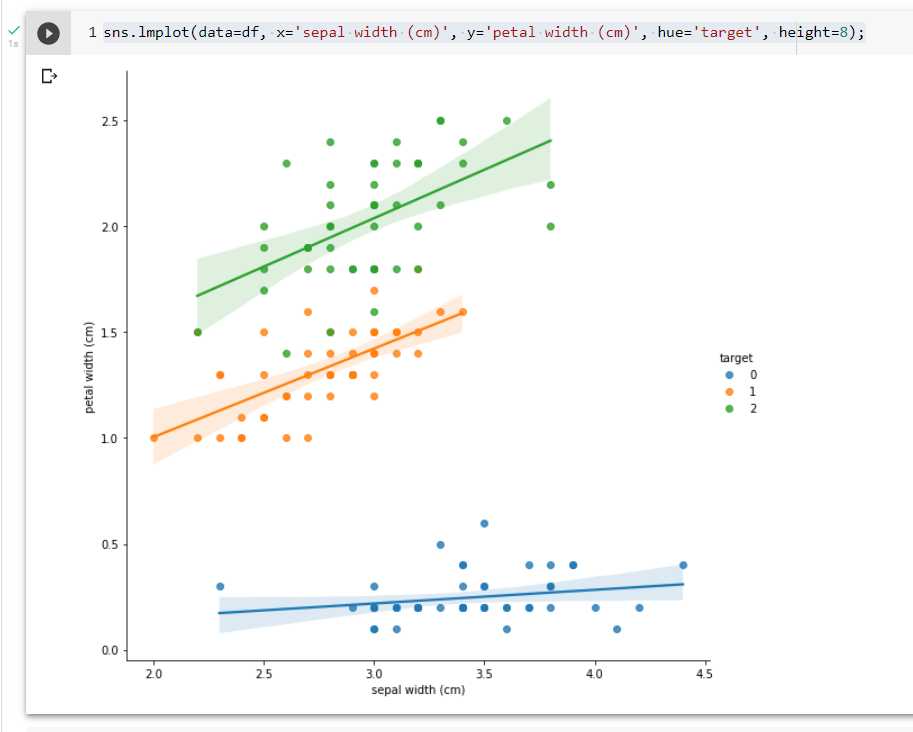
Now, display a line plot fitted to sepal width (cm) and the mean petal width (cm) columns. Points are colored according to the target column using sns.lmplot:
sns.lmplot(data=df, x='sepal width (cm)', y='petal width (cm)', hue='target', height=8);And here is the output:
With all the remarkable benefits Google Colab provides, you still need to be cautious about the Runtime Disconnected Error that will arise if you don’t actively use the notebook for a while.
It is also often forgotten that even though you share your Colab link with anyone, they still cannot reach the datasets you uploaded to the respective notebook.
This means that if any of the code requires reading the data available in the Files section, they will be unable to run that code unless they also upload the same data.
Conclusion
In this article, we have seen what Google Colab offers. It is a great cloud-based environment that allows you free access to GPU/TPU, mounting your Google Drive, displaying powerful visualizations in an interactive environment, and more.
Can you see how useful is to learn Google Colab? Become familiar with it in the same way you would with Jupyter notebook.
That said you should still watch out for Runtime Disconnected Error and Session Crash Error in your notebook to not let your job suddenly disappear.

Claudio Sabato is an IT expert with over 15 years of professional experience in Python programming, Linux Systems Administration, Bash programming, and IT Systems Design. He is a professional certified by the Linux Professional Institute.
With a Master’s degree in Computer Science, he has a strong foundation in Software Engineering and a passion for helping others become Software Engineers.